I wanted to share an advancement that has truly simplified my life when it comes to tracking the performance of my websites. Like many others, I was juggling multiple tools: AdSense for ad revenue, Search Console for SEO, and Matomo for visitor analytics. After constantly switching between these platforms, I decided to centralize all this data into a single Grafana dashboard. Here’s how I did it! Note this is also possible with Google Analytics GA4 instead of Matomo.
Why I Wanted to Centralize Everything in Grafana
If you manage multiple sites, you know how tedious it can be to switch between tools to analyze trends and understand what’s working. My goal was simple: **have a unified and consolidated view** of performance without wasting time.
By combining AdSense, Search Console, and Matomo in Grafana, I was able to:
- Easily compare the performance of multiple sites.
- Save time by avoiding opening three different tools.
- Set up alerts in case of sudden drops in traffic or revenue.
How I Integrated AdSense, Search Console, and Matomo into Grafana
1. Extracting AdSense Data
I developed a PHP API to automatically retrieve my AdSense statistics using the official API. The key metrics I use are:
- Daily and monthly revenue
- Number of impressions and clicks
- CPC (Cost per Click) and CPM (Cost per Thousand Impressions)
This data is then stored in a MySQL database for easier use.
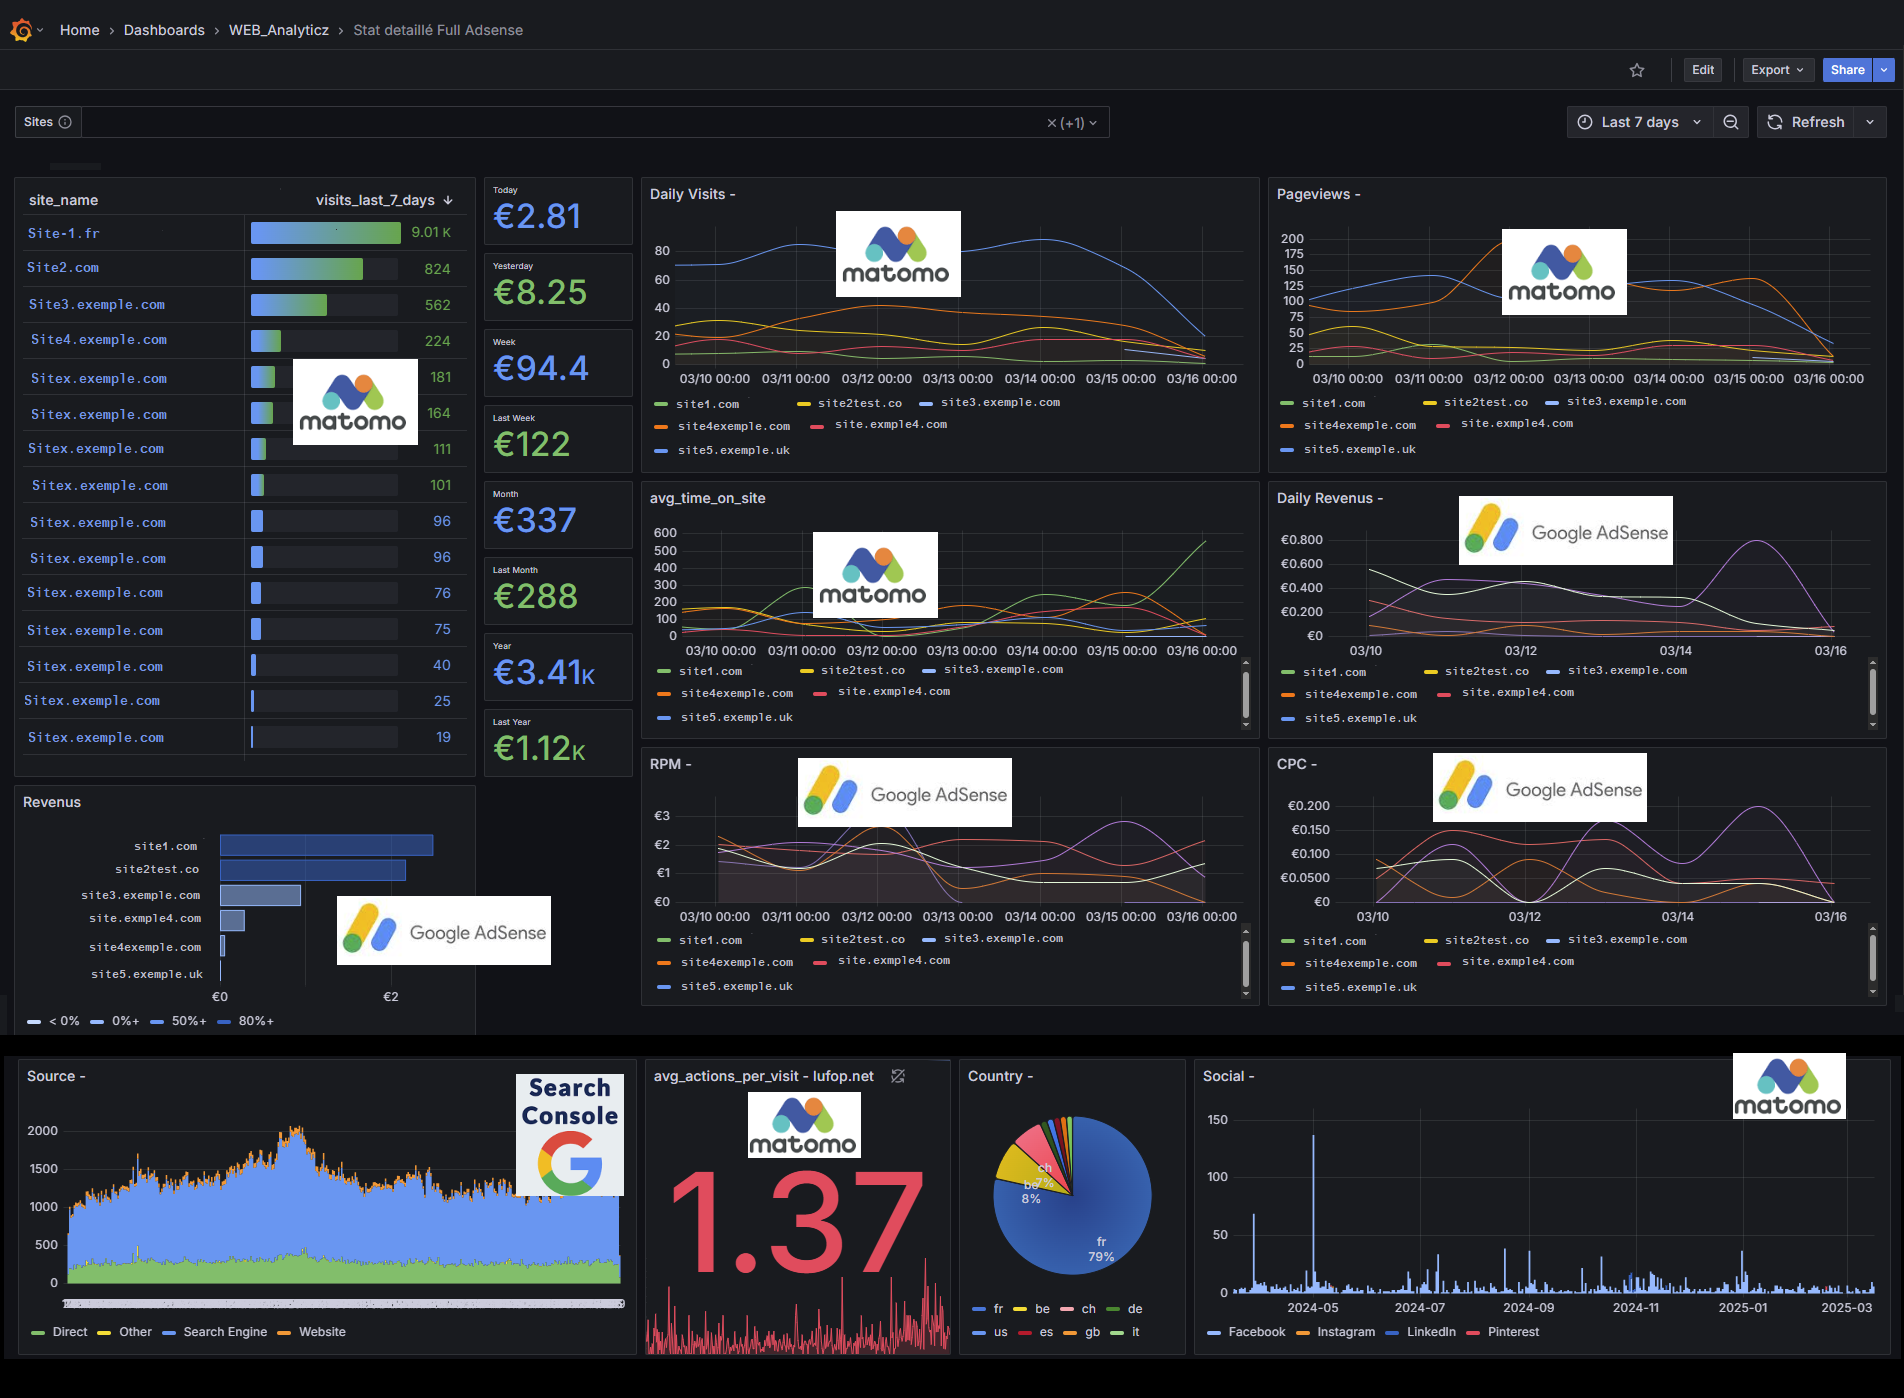
Example of data in Grafana:
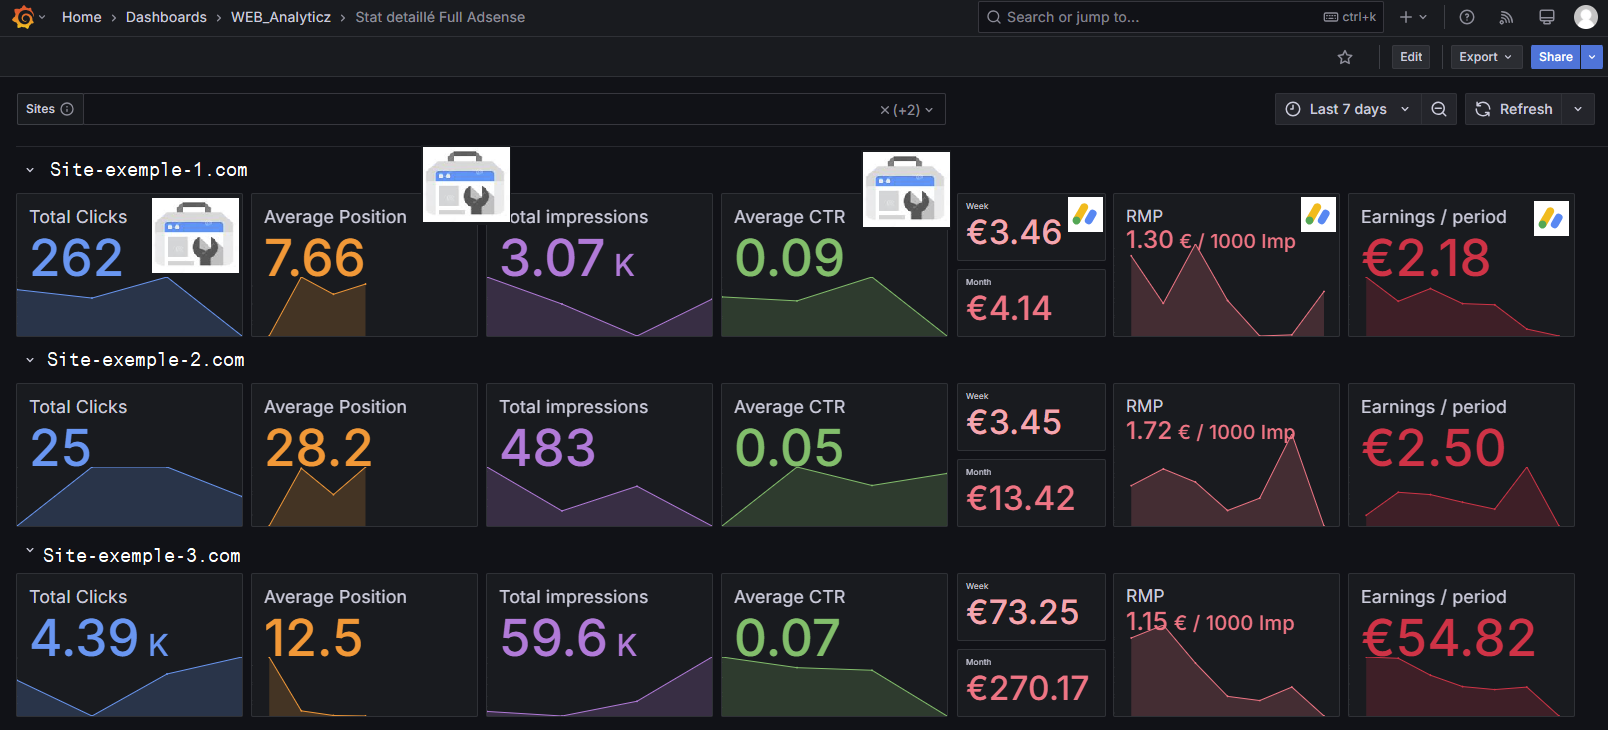 Here we have AdSense and Search Console data.
2. Connecting to the Google Search Console API
Next, I integrated the Google Search Console API to track SEO performance. I retrieve data such as:
- Queries that generate traffic
- Number of clicks and impressions
- Click-through rate (CTR) and average position
All this data is also stored in the database, allowing me to analyze trends over multiple periods. You can find the documentation for the Google Search Console API here.
3. Connecting and Using Matomo Data
Since Matomo was already installed to track my visitors, I directly used its database. This allowed me to display statistics such as:
- Number of unique visitors
- Average session duration
- Bounce rate and most viewed pages
To learn more about Matomo, which in my case replaces Google Analytics, check out this link: Discover Matomo and its advantages (e.g., GDPR compliance).
Setting Up the Grafana Dashboard
Once all this data was collected and stored, I configured an **interactive dashboard** in Grafana. It allows me to:
- Filter and compare the performance of multiple sites.
- Visualize trends in AdSense revenue and SEO traffic on the same graph.
- Receive alerts in case of abnormal drops in revenue or traffic.
The Result and What It Brings Me
Thanks to this dashboard, I can **monitor my sites at a glance** and anticipate problems much faster. No more need to open three different tools: everything is visible in one place!
Upcoming Improvements:
- Tracking Core Web Vitals to monitor page speed and quality.
- Adding social media statistics to complement the analysis.
- Connecting to the Google Indexing API to see which pages are indexed in real-time.
If you’d like to set up a similar dashboard or have questions, feel free to share your experience in the comments!
Next Steps: Technical Details
Possibility to add Analytics GA4 and page speed Insight data (using their API).
Each step I mentioned here will be covered in a detailed article with tutorials, code, and screenshots. You’ll be able to easily replicate this system for your own sites. Stay tuned and let me know if you’re interested in this topic!